The algorithm with details and the example with the data used can be found: here and the data to use, in excel format, can be found here .
What for?
Every year, the Graduate Institute of Geneva lauches its Applied Research Projects (ARP). It targets interdisciplinary master students and is an long term group project together with an institutional partner (International Organizations, Non-Governmental Organizations, companies, start-ups, etc.). There are a given number of pre-selected projects for a given number of students. Details on ARP are to be found here.
Constraints
A minimum number of students is imposed (and a maximum too). All pre-selected projects must have students allocated.
Before the allocation, students are asked to rank their preferences. They attribute their first-best preferences to a handful of projects, their second-best preferences to another set of projects, their third-best prefrences to another; lastly, the remaining projects are not part of the projects students considered interesting for them to work on.
Ideally, all students are assigned their top preferences but, empirically, the allocation is rarely fully composed of first-best preferences.
Hungarian Algorithm (Kuhn, 1955)
The present algorithm attemps to allocate students as well as possible, minimizing dissatisfaction. The most common and simple procedure used is the Hungarian algorithm and the current algothim is based on it. This is a linear optimization procedure where a cost matrice is minimized (or maximized). In practice, the procedure is relatively simple and consists in erasing step by step columns and rows. In the end, the selection starts with the first row(s) attributed with only one zero in all the columns.
In a nutshell
This algorithm, entirely shown below with details, assumes that allocating students a non preferred choice is unreasonably “expensive” so that the minimization of the cost matrix dramatically suffers from allocating a student to a non-chosen project. Indeed, weights 0 are given to top choices, 3 to second best, 10 to third best, 20 to fourth best, and 50 to fifth best, and 1000 to non-chosen projects (!). Therefore, if the algorithm allocates a student to a non-chosen project, it is mechanically because no other students (or k students supposed to be assigned to this group) have selected this project. This implies that there might be a discretionary decision not to keep this project if not enough students selected this project among the selected preferences.
Overall, this algorithm is very simple, transparent in its method and extremely fast to be implemented (the full code for one allocation, along with data cleaning and some summary statistics takes less than 3 seconds - on my laptop). Suffices to have an excel file ready with students’ preference like the one of year 2022. If constructing a different data set, one simply needs to be careful in dropping the appropriate variables. Fundamentally, students’ index and students’ ranking for each project are the only necessary variables. The data inspection section might be edited depending on the excel data set loaded (and it is easy to drop proprietary excel towards .csv or any other data set formats).
Important drawback
This is a specific algorithm well-suited for such allocation. However, the price to pay to an easy and efficient allocation is the lack of refinement such as the inclusion of heterogeneous characteristics on top of students’ preferences. Here, there is no account for extra characteristics such as language match between the students’ skills and the partners’ needs. There is also no ad hoc matching where some partners would have requested 5 students or, on the contrary, 2 students. Here all partners are treated equally and so are students’ preferences. In some respect, this overly simple allocation has the advantage of fairness towards partners and students.
Some extra information to assess the quality of the allocation
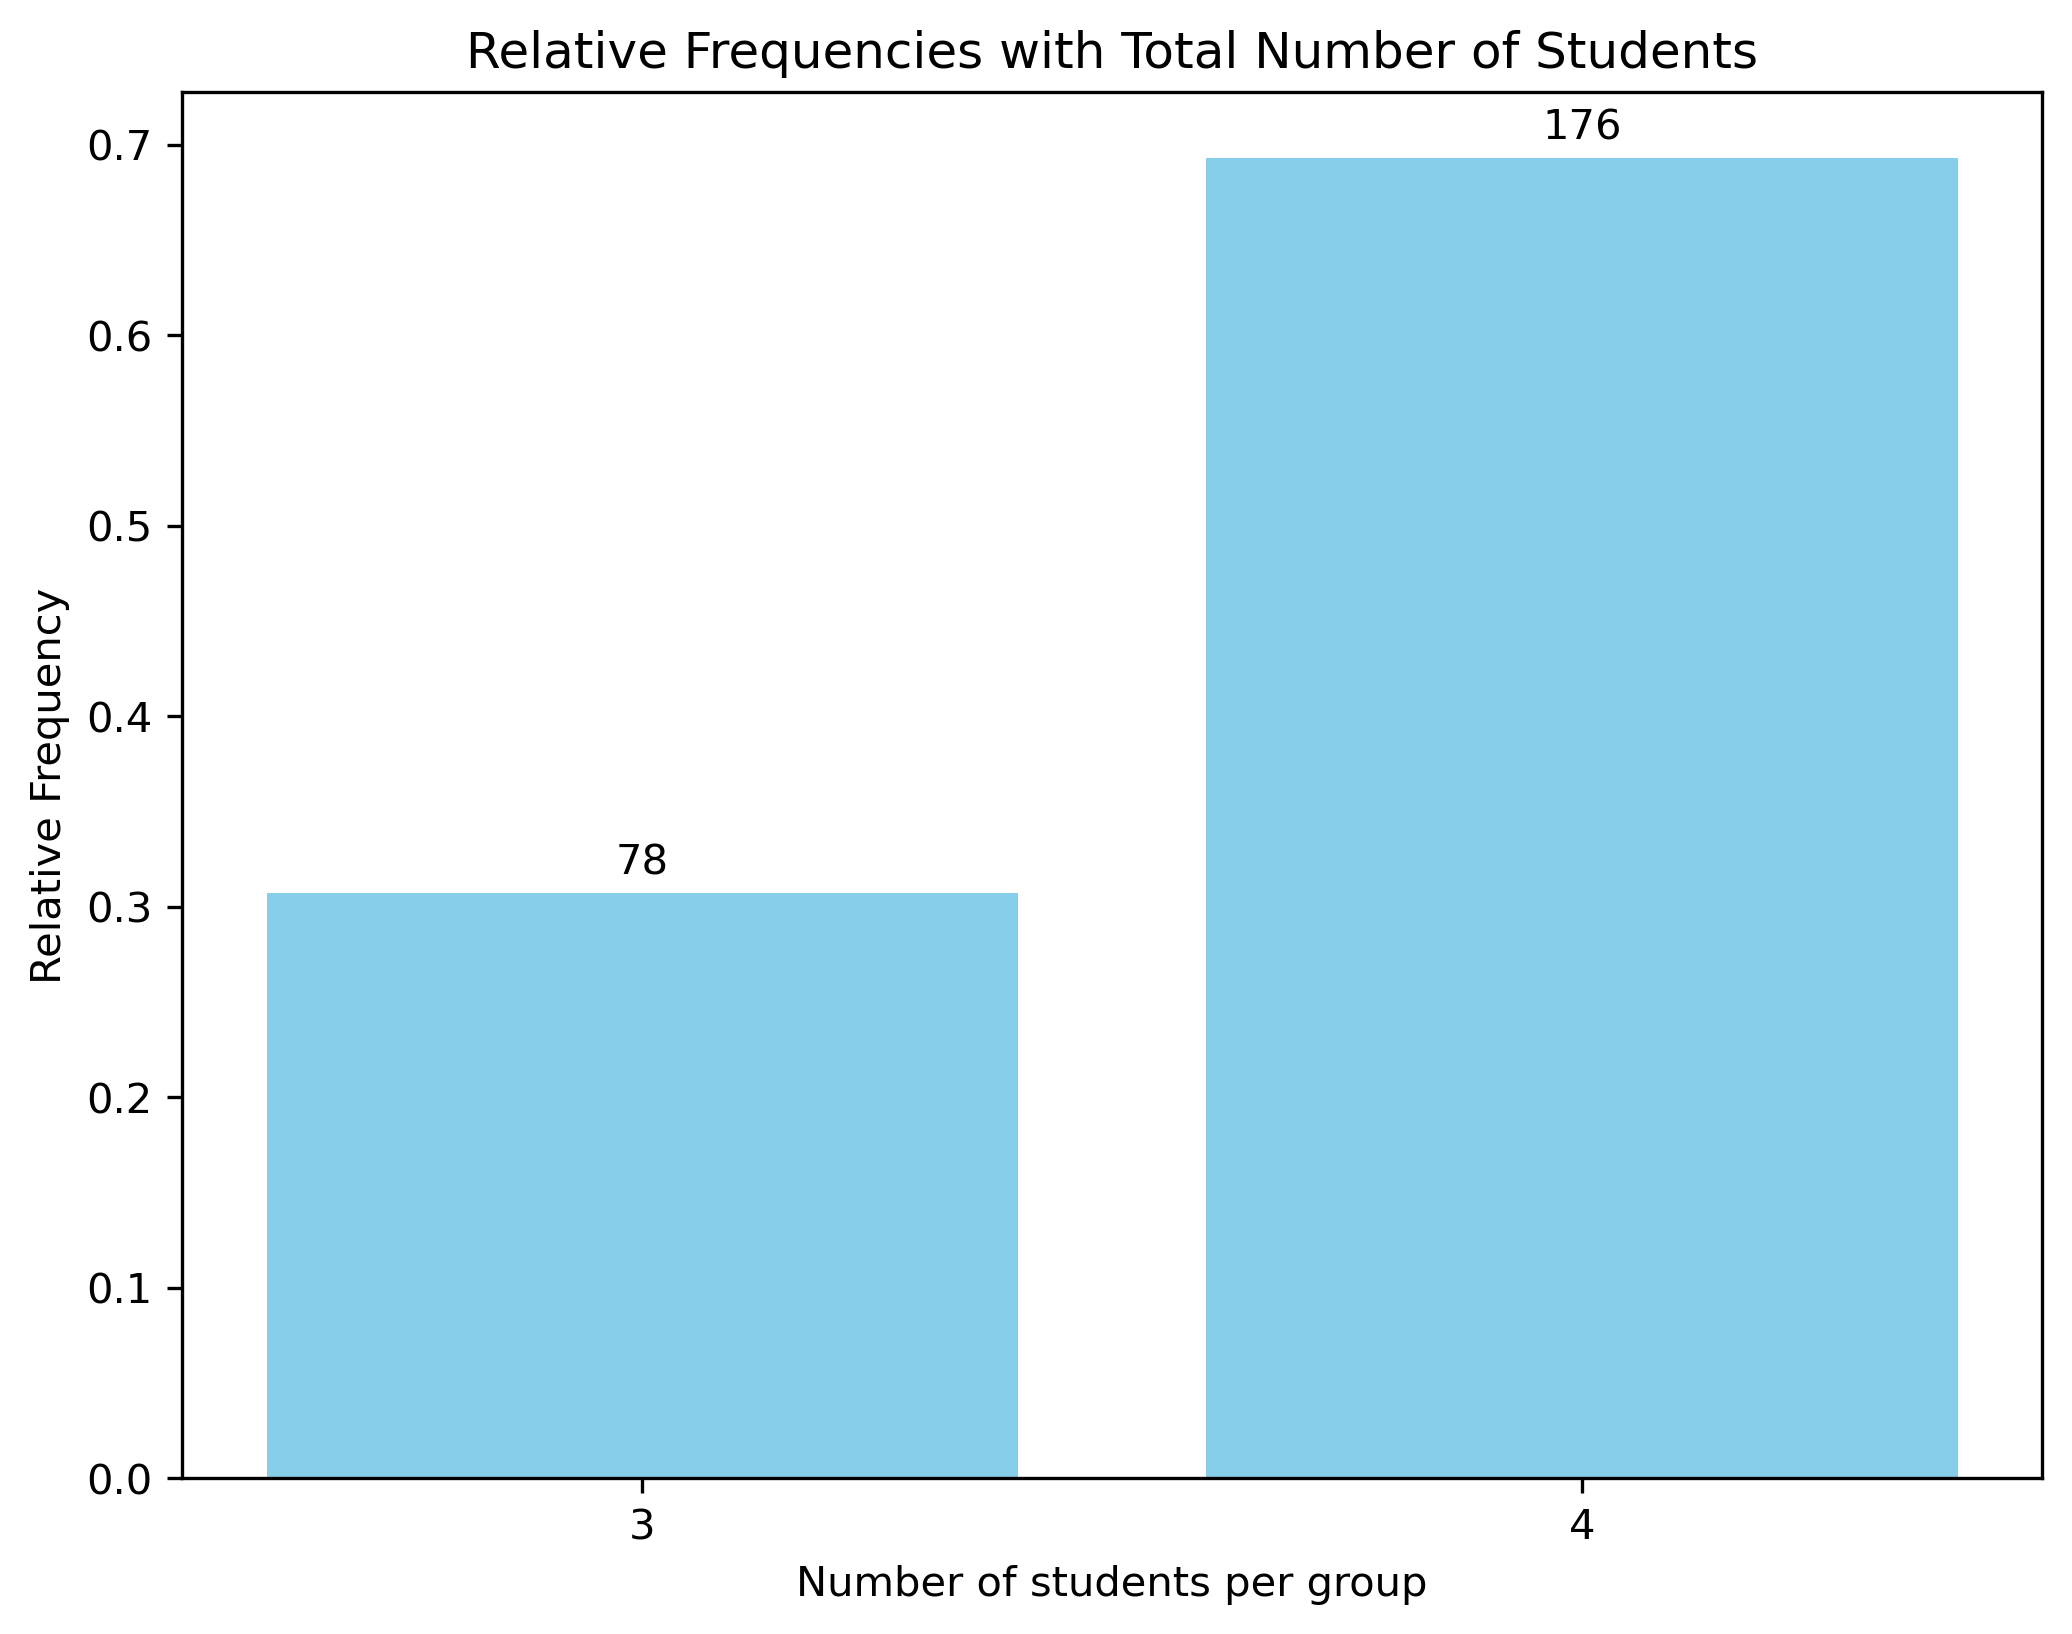
Visualize the share of students per group size
Visualize the share of groups with different number of students. The bar chart shows that there are only groups with three or four students, which is what was initially scheduled.
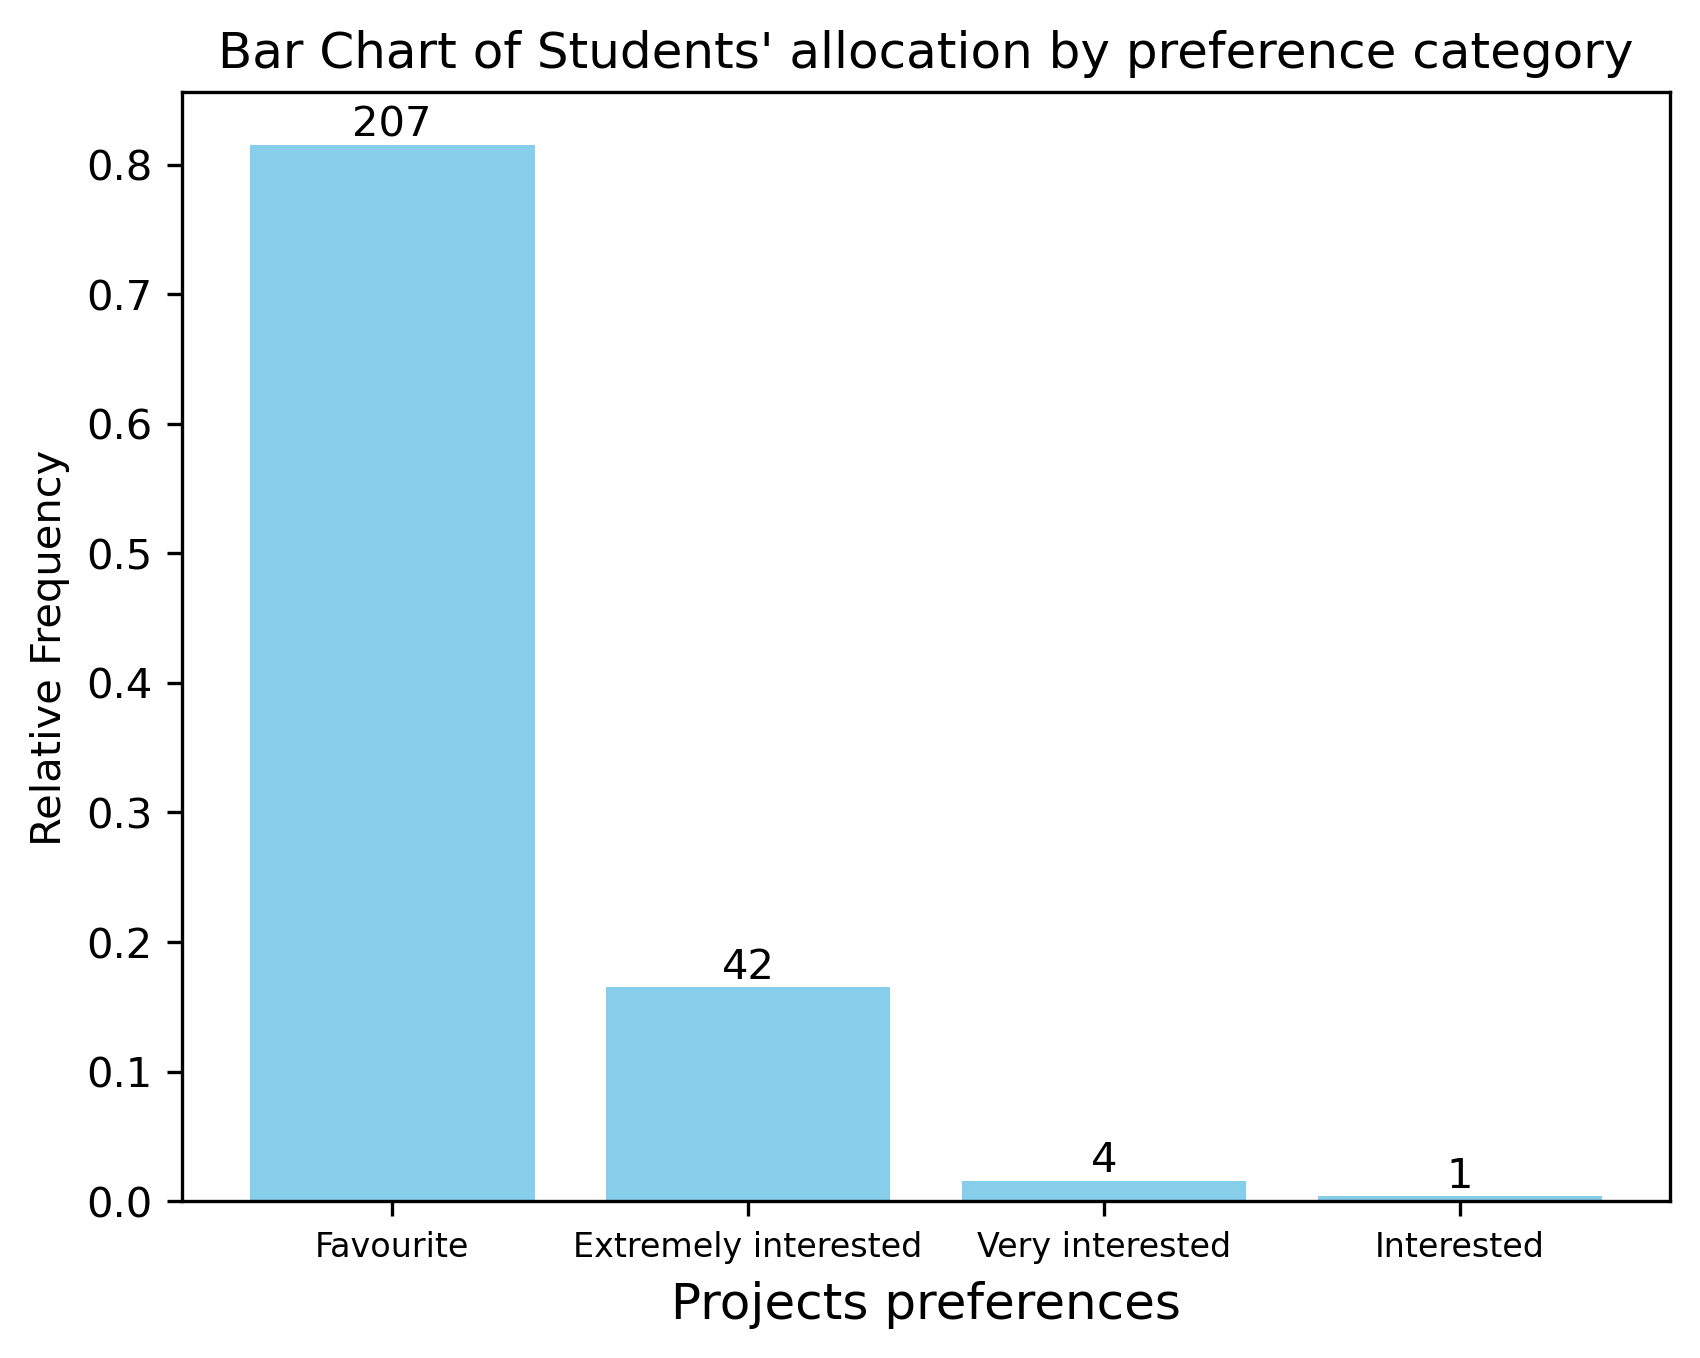
Visualize the number (and share) of students allocated depending on their preferences
Visualize the frequency of students obtaining their first, second and third choices. Beyond 80% of the students obtained their top choice, less than 1.4% of all students obtained a project in their third best set of projects. No student obtained a project that was not part of any preferred project.
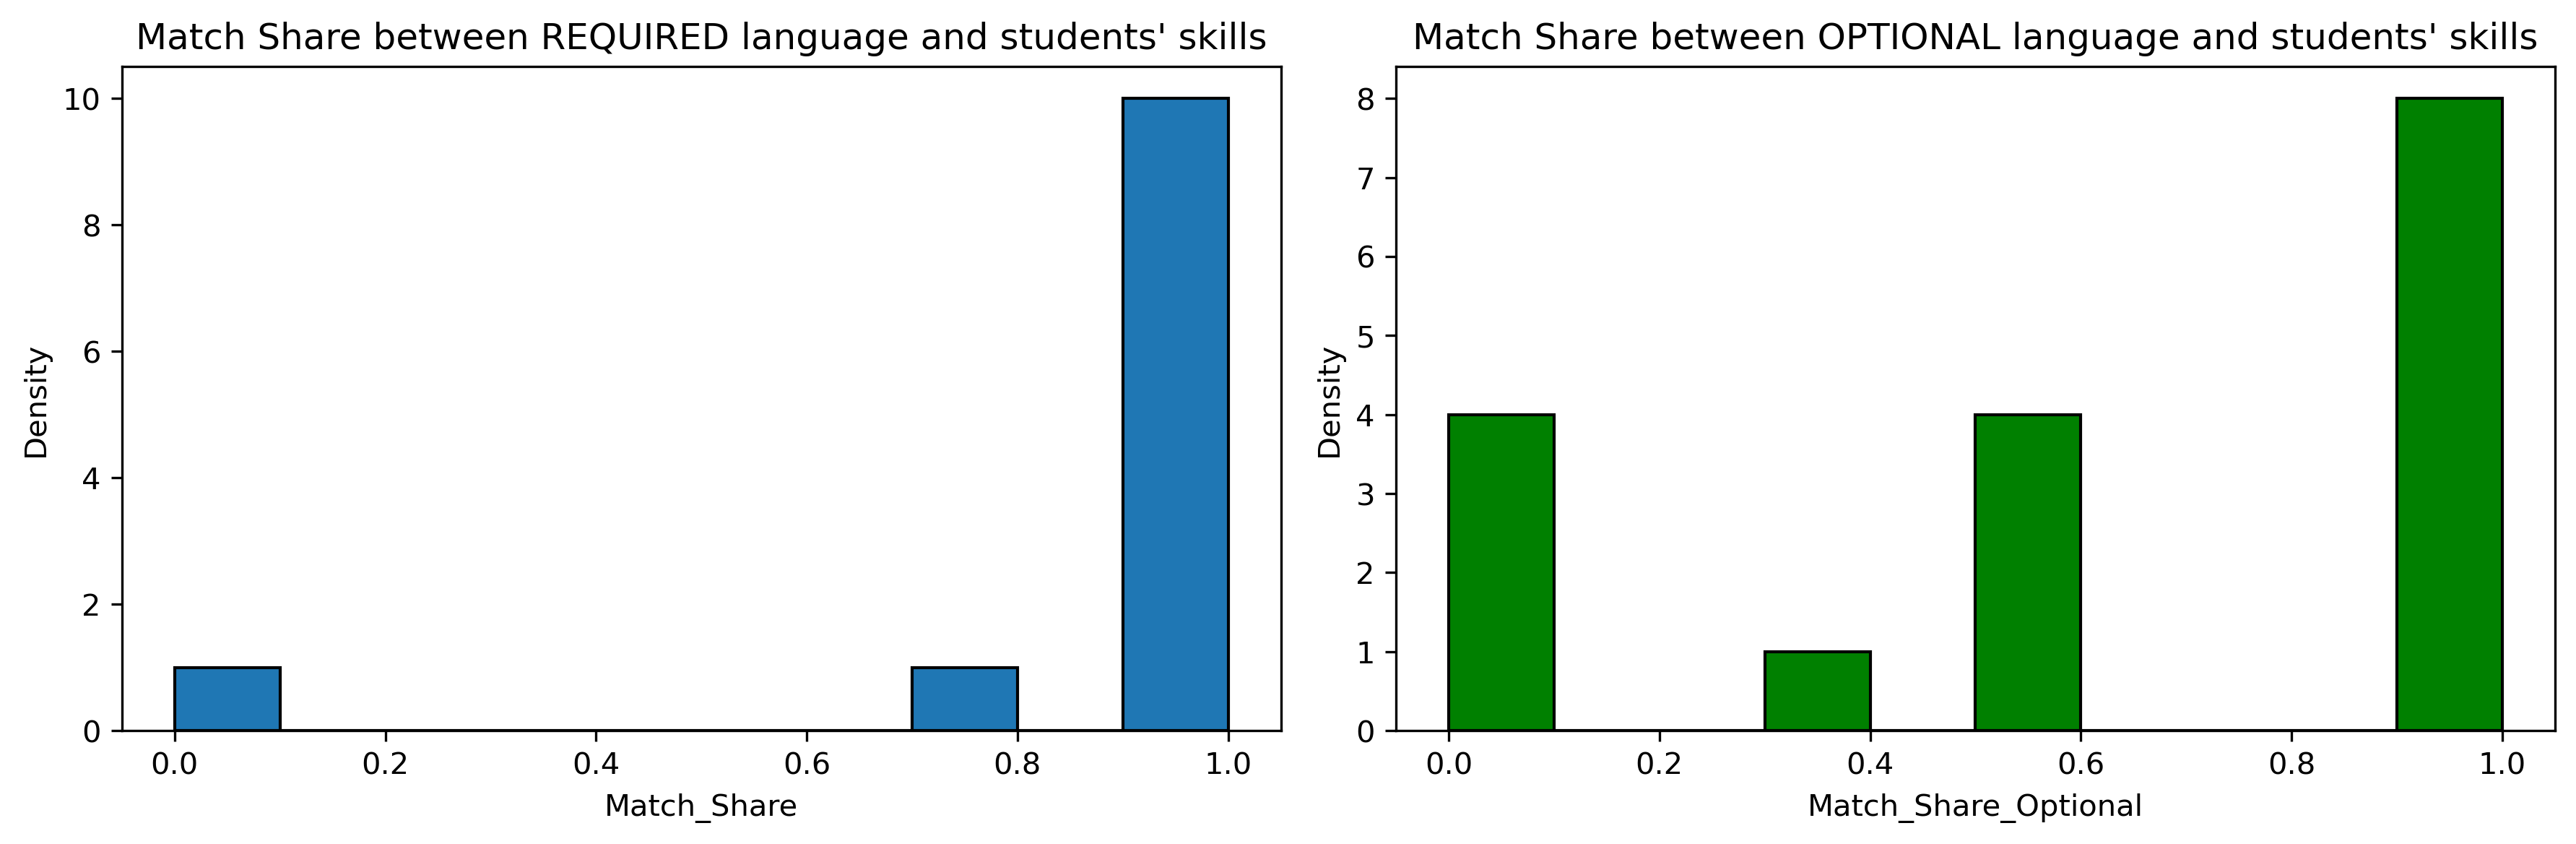
Check the language skills
Importantly, students were asked about their language skills in order to ensure that the matching was also according to the language matching. Some partners informed on language requirements and/or on language preferred in the group (because of interviews to be conducted, literature only available in the local language, etc.). Unfortunately, this method cannot take such heterogeneity into account. That is the price of having a very simply and fully transparant analysis.
However, one can argue that the self-selection of students will lead the allocation based on preference to allow for a sound language allocation on top of the students’ preferences. It is expected that students must have internalized the language constraints into their preferences sorting. In fact, this is probably better to allocate using a simply algorithm and entrusting students so that language allocation is also appropriate. If not, it is not unrealistic to have the students bear the responsability of their own choices - as they were duly informed about the importance of the language allocation beforehand.